

Want more housing market stories from Lance Lambert’s ResiClub in your inbox? Subscribe to the ResiClub newsletter.
When assessing home price momentum, ResiClub believes it’s important to monitor active listings and months of supply. If active listings start to rapidly increase as homes remain on the market for longer periods, it may indicate pricing softness or weakness. Conversely, a rapid decline in active listings beyond seasonality could suggest a market that is heating up.
Since the national pandemic housing boom fizzled out in 2022, the national power dynamic has slowly been shifting directionally from sellers to buyers. Of course, across the country, that shift has varied.
Generally speaking, local housing markets where active inventory has jumped above pre-pandemic 2019 levels have experienced softer home price growth (or outright price declines) over the past 36 months.
Conversely, local housing markets where active inventory remains far below pre-pandemic 2019 levels have, generally speaking, experienced, relatively speaking, more resilient home price growth over the past 42 months.
Where is national active inventory headed?
National active listings are on the rise on a year-over-year basis (+10% between January 31, 2025, and January 31, 2026). This indicates that homebuyers have gained some leverage in many parts of the country over the past year. Some seller’s markets have turned into balanced markets, and more balanced markets have turned into buyer’s markets.
Nationally, we’re still below pre-pandemic 2019 inventory levels (-17.8% below January 2019), and some resale markets (in particular, chunks of the Midwest and Northeast) still remain, relatively speaking, tight-ish.
While national active inventory is still up year over year, the pace of growth has slowed in recent months as softening has slowed.
Here are the January inventory/active listings totals, according to Realtor.com:
- January 2017 -> 1,154,120 📉
- January 2018 -> 1,043,951 📉
- January 2019 -> 1,110,636 📈
- January 2020 -> 951,675 📉
- January 2021 -> 531,775 📉 (Pandemic housing boom overheating)
- January 2022 -> 376,970 📉 (Pandemic housing boom overheating)
- January 2023 -> 616,865 📈
- January 2024 -> 665,569 📈
- January 2025 -> 829,376 📈
- January 2026 -> 912,696 📈
If we maintain the current year-over-year pace of inventory growth (+83,320 homes for sale), we’d have 996,016 active inventory come January 2027. (Note: That’s not a prediction—I’m just showing what the math looks like if that pace continued.)
Below is the year-over-year active inventory percentage change by state.
window.addEventListener(“message”,function(a){if(void 0!==a.data[“datawrapper-height”]){var e=document.querySelectorAll(“iframe”);for(var t in a.data[“datawrapper-height”])for(var r,i=0;r=e[i];i++)if(r.contentWindow===a.source){var d=a.data[“datawrapper-height”][t]+”px”;r.style.height=d}}});
While active housing inventory is rising in most markets on a year-over-year basis, the pace of growth continues to decelerate across much of the country.
LEFT: Year-over-year active inventory shift between January 2024 and January 2025
RIGHT: Year-over-year active inventory shift between January 2025 and January 2026
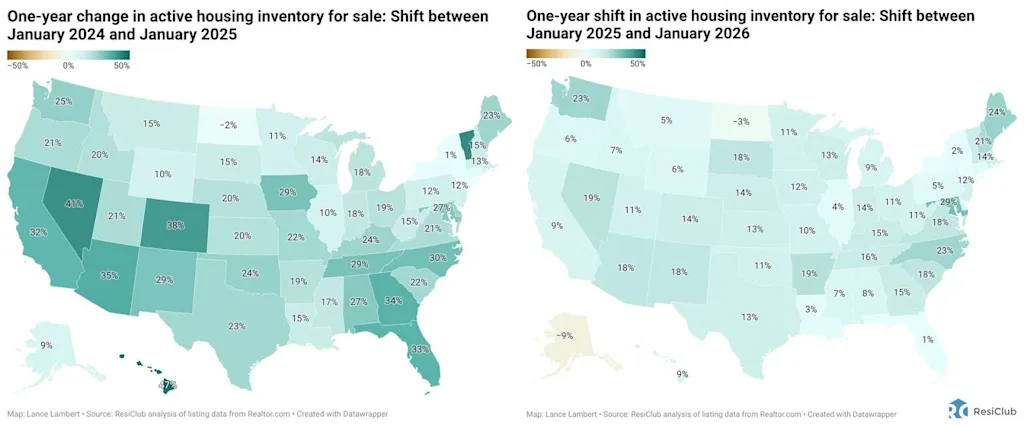
And while active housing inventory is rising in most markets on a year-over-year basis, some markets still remain tight-ish (although it’s loosening in those places, too).
As ResiClub has been documenting, both active resale and new homes for sale remain the most limited across huge swaths of the Midwest and Northeast. That’s where home sellers in the spring are likely, relatively speaking, to have more power than their peers in many Southern markets.
In contrast, active housing inventory for sale has neared or surpassed pre-pandemic 2019 levels in many parts of the Sun Belt and Mountain West, including metro-area housing markets such as Austin and Punta Gorda, Florida.
Many of these areas saw major price surges during the pandemic housing boom, with home prices getting stretched when compared with local incomes. As pandemic-driven domestic migration slowed and mortgage rates rose, markets like Punta Gorda and Austin faced challenges, relying on local income levels to support frothy home prices.
This softening trend was accelerated further by an abundance of new home supply in the Sun Belt. Builders are often willing to lower prices or offer affordability incentives (if they have the margins to do so) to maintain sales in a shifted market, which also has a cooling effect on the resale market: Some buyers, who would have previously considered existing homes, are now opting for new homes with more favorable deals—which then puts some additional upward pressure on resale inventory.
window.addEventListener(“message”,function(a){if(void 0!==a.data[“datawrapper-height”]){var e=document.querySelectorAll(“iframe”);for(var t in a.data[“datawrapper-height”])for(var r,i=0;r=e[i];i++)if(r.contentWindow===a.source){var d=a.data[“datawrapper-height”][t]+”px”;r.style.height=d}}});
At the end of January 2026, nine states were above pre-pandemic 2019 active inventory levels: Arizona, Colorado, Florida, Idaho, Nebraska, Tennessee, Texas, Utah, and Washington. (The District of Columbia—which we left out of this table below—is also back above pre-pandemic 2019 active inventory levels. Softness in D.C. proper predates the current admin’s job cuts.)
window.addEventListener(“message”,function(a){if(void 0!==a.data[“datawrapper-height”]){var e=document.querySelectorAll(“iframe”);for(var t in a.data[“datawrapper-height”])for(var r,i=0;r=e[i];i++)if(r.contentWindow===a.source){var d=a.data[“datawrapper-height”][t]+”px”;r.style.height=d}}});
Big picture: Over the past few years, we’ve observed a softening across many housing markets as strained affordability tempers the fervor of a market that was unsustainably hot during the pandemic housing boom. While home prices are falling some in pockets of the Sun Belt, a big chunk of Northeast and Midwest markets still eked out a little price appreciation in 2025. Year over year, nationally aggregated home prices were pretty close to flat.
window.addEventListener(“message”,function(a){if(void 0!==a.data[“datawrapper-height”]){var e=document.querySelectorAll(“iframe”);for(var t in a.data[“datawrapper-height”])for(var r,i=0;r=e[i];i++)if(r.contentWindow===a.source){var d=a.data[“datawrapper-height”][t]+”px”;r.style.height=d}}});
Below is another version of the table above—but this one includes every month since January 2017.
window.addEventListener(“message”,function(a){if(void 0!==a.data[“datawrapper-height”]){var e=document.querySelectorAll(“iframe”);for(var t in a.data[“datawrapper-height”])for(var r,i=0;r=e[i];i++)if(r.contentWindow===a.source){var d=a.data[“datawrapper-height”][t]+”px”;r.style.height=d}}});
If you’d like to further examine the monthly state inventory figures, use the interactive below.
Over the coming months, let’s keep an eye on Florida, which has now entered its seasonal window when its active inventory typically begins to rise again. (To better understand softness and weakness across Florida over the past couple years, read this ResiClub PRO report.)
window.addEventListener(“message”,function(a){if(void 0!==a.data[“datawrapper-height”]){var e=document.querySelectorAll(“iframe”);for(var t in a.data[“datawrapper-height”])for(var r,i=0;r=e[i];i++)if(r.contentWindow===a.source){var d=a.data[“datawrapper-height”][t]+”px”;r.style.height=d}}});