
Want more housing market stories from Lance Lambert’s ResiClub in your inbox? Subscribe to the ResiClub newsletter.
Single-family home prices have risen dramatically across the United States over the past four decades. But the gains haven’t been even across the board.
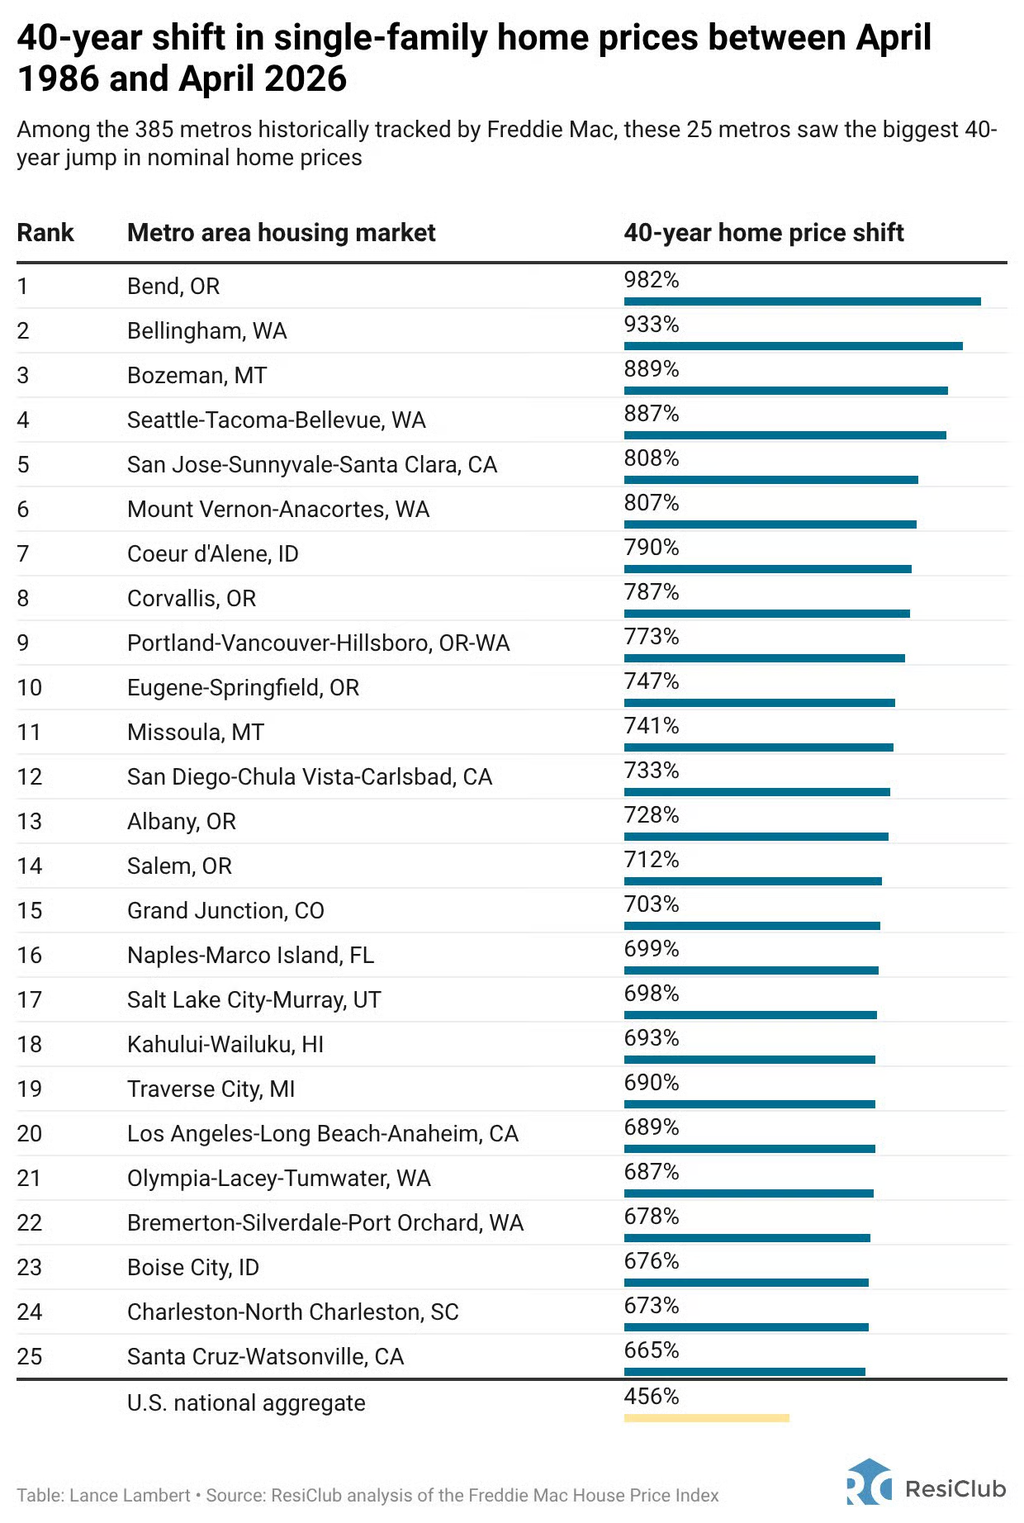
The map below highlights the 25 metro areas that have seen the biggest increase in single-family home prices over the past 40 years.
(function(){function e(){window.addEventListener(`message`,function(e){if(e.data[`datawrapper-height`]!==void 0){var t=document.querySelectorAll(`iframe`);for(var n in e.data[`datawrapper-height`])for(var r=0,i;i=t[r];r++)if(i.contentWindow===e.source){var a=e.data[`datawrapper-height`][n]+`px`;i.style.height=a}}})}e()})();
At the top of the list are:
- Bend, Oregon (+982%)
- Bellingham, Washington (+933%)
- Bozeman, Montana (+889%)
- Seattle-Tacoma (+887%)
- San Jose (+808%)
Generally speaking, the nation’s biggest home price gains over the past 40 years have occurred in desirable Western metros, particularly across the Pacific Northwest and Northern California.
Overall, 22 of the 25 metro areas are located west of the Mississippi River. That pattern isn’t a coincidence.
Over the past several decades, many of these markets experienced stronger-than-average wage growth as high-paying industries—including technology, finance, and professional services—expanded. Higher incomes gave households greater purchasing power, allowing buyers to bid home prices higher over time.
The importance of local income growth becomes clear when comparing markets with very different economic trajectories.
Let’s consider the Youngstown, Ohio, and Seattle-Tacoma metro areas. Since April 1986, single-family home prices have increased 297% in Youngstown, compared to 887% in Seattle. Over that same period, national home prices have risen 456%.
While both metros experienced the same national housing cycles—from the inflationary boom of the late 1970s to the housing crash and the pandemic-era surge—their long-term economic stories diverged dramatically.
Seattle-Tacoma benefited from decades of robust wage growth as the region emerged as one of the nation’s leading technology and innovation hubs, anchored by companies like Microsoft and Amazon. Higher-paying jobs attracted workers from across the country and around the world, giving households greater purchasing power to bid up home prices.
Youngstown experienced the opposite trajectory. As manufacturing employment declined during the era of deindustrialization, the region saw much slower income growth and weaker population trends. With less purchasing power flowing into the local housing market, home prices appreciated at a much more modest pace.
Demand is only one side of the equation. The pace of home price appreciation also depends on how quickly housing supply can respond. Many Western markets face natural geographic constraints—from coastlines and mountains to protected public lands—that limit where homes can be built.
In many cases, including in housing markets like Seattle, those physical barriers have been compounded by stricter land-use regulations and slower homebuilding. Those constraints have made it harder to build enough homes to keep up with demand.
Of course, long-term winners don’t always lead in the short run. Several Pacific Northwest housing markets have recently entered a period of cyclical cooling as inventory has increased and price growth has moderated.
Big picture: Over multiple decades, the housing markets that paired strong income growth with persistent housing supply constraints have consistently generated the nation’s largest home price gains.